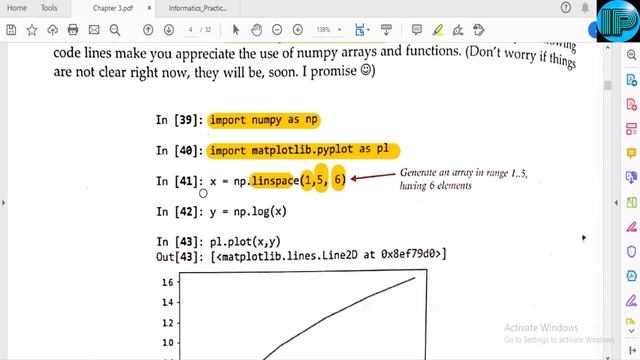
Data Visualization Matplotlib.pyplot Part 1 Class 12 IP Informatics Practices Python - видео
In this video we are explaining about Data Visualization of Unit 1 of Informatics Practices for class 12th. This video is according to the new syllabus of Informatics Practices Session 2020-21. Here we are explaining about the purpose of Data Visualization Matplotlib library Pyplot Interface Installation of Matplotlib library Basic functions provided by pyplot Bar graph Line Chart Scatter Chart Histogram etc. Here we will also study about the customization of graphs like changing color of the gra...
Источник видео: RuTube.ru (Обучение)


ЗДРАВСТВУЙТЕ ! ОГРОМНОЕ СПАСИБО ЗА ВАШИ РАСКЛАДЫ! ОНИ СОГРЕВАЮТ И ОБНАДЕЖИВАЮТ!
Добрый вечер!!!!! Большое, большое Вам спасибо!!!!! Хорошего вечера!!!!!
БлагоДарю!
Ильич наше ВСЁ...
Спасибо